Phone: For support in Australia, call 1300 401 111 and select option 3 for Bp Allied. Next, select option 1 for Support or Option 3 for Training. For support in New Zealand call 0800 401 111 and select option 3 for Bp Allied. Next, select option 1 for Support or Option 3 for Training
Using the Statistics Report
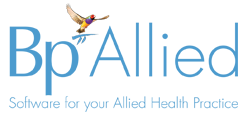
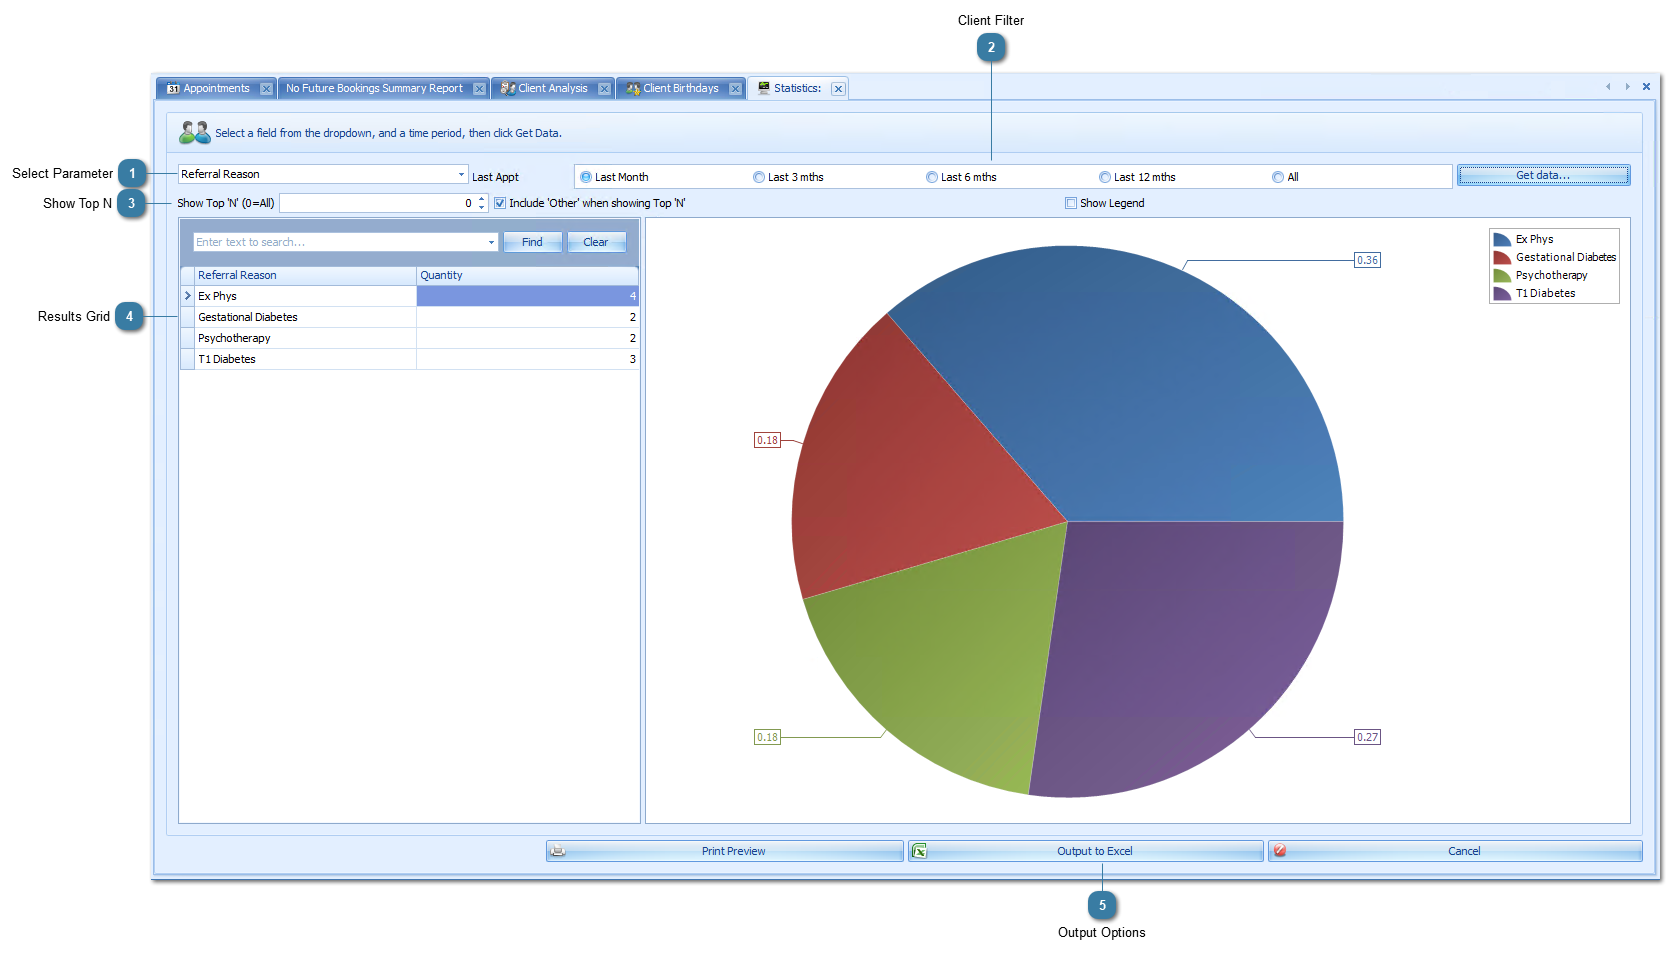
This report is designed to show in graphical form the breakdown of various client parameters, e.g. Medications or Medical Conditions. Details of the clients included in these statistics can be viewed from the Analysis report.
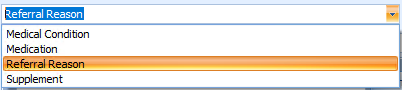
If there is a long list of results, e.g. many different medications, then changing the value can be used to display the top 10 or 20 etc results.
Ticking the Include Other when showing Top N tickbox gives the option to include all other values that fall outside this list as a group and displayed as "Other".